

Data Visualization Tools Market Expected to Reach $17.24 Billion by 2030 Driven by Robust Industry Expansion
Data Visualization Tools Market
Data Visualization Tools Market growth
Data Visualization Tools Market size
The Business Research Company’s Data Visualization Tools Global Market Report 2026 – Market Size, Trends, And Forecast 2026-2035
LONDON, GREATER LONDON, UNITED KINGDOM, October 12, 2026 /EINPresswire.com/ -- Understanding the rapid evolution of data visualization tools is essential as businesses increasingly depend on visual analytics to make sense of growing data volumes. This market, a crucial segment of the broader Virtual Reality Software industry, is set to experience significant expansion by 2030, driven by technological advances and shifting enterprise needs. Let’s explore the current market size, key growth factors, major players, and emerging trends shaping this dynamic field.
Projected Market Size and Growth Outlook for Data Visualization Tools
The data visualization tools market is forecasted to surpass $17 billion by 2030. This sector forms a substantial portion—about 29%—of the larger Virtual Reality Software market, which itself is expected to reach nearly $60 billion by that year. Positioned within the vast Information Technology industry, projected to be worth $13,788 billion by 2030, data visualization tools will account for nearly 0.1% of the total market value, highlighting its growing but focused role in IT.
Request A Free Sample Of The Data Visualization Tools Market Report
https://thebusinessresearchcompany.com/sample_request?id=18589233&type=smp&name=Data%20Visualization%20Tools%20Market%20Report%202026&utm_source=EINPresswire&utm_medium=Paid&utm_campaign=Oct_PR
Factors Fueling Expansion in the Data Visualization Tools Market
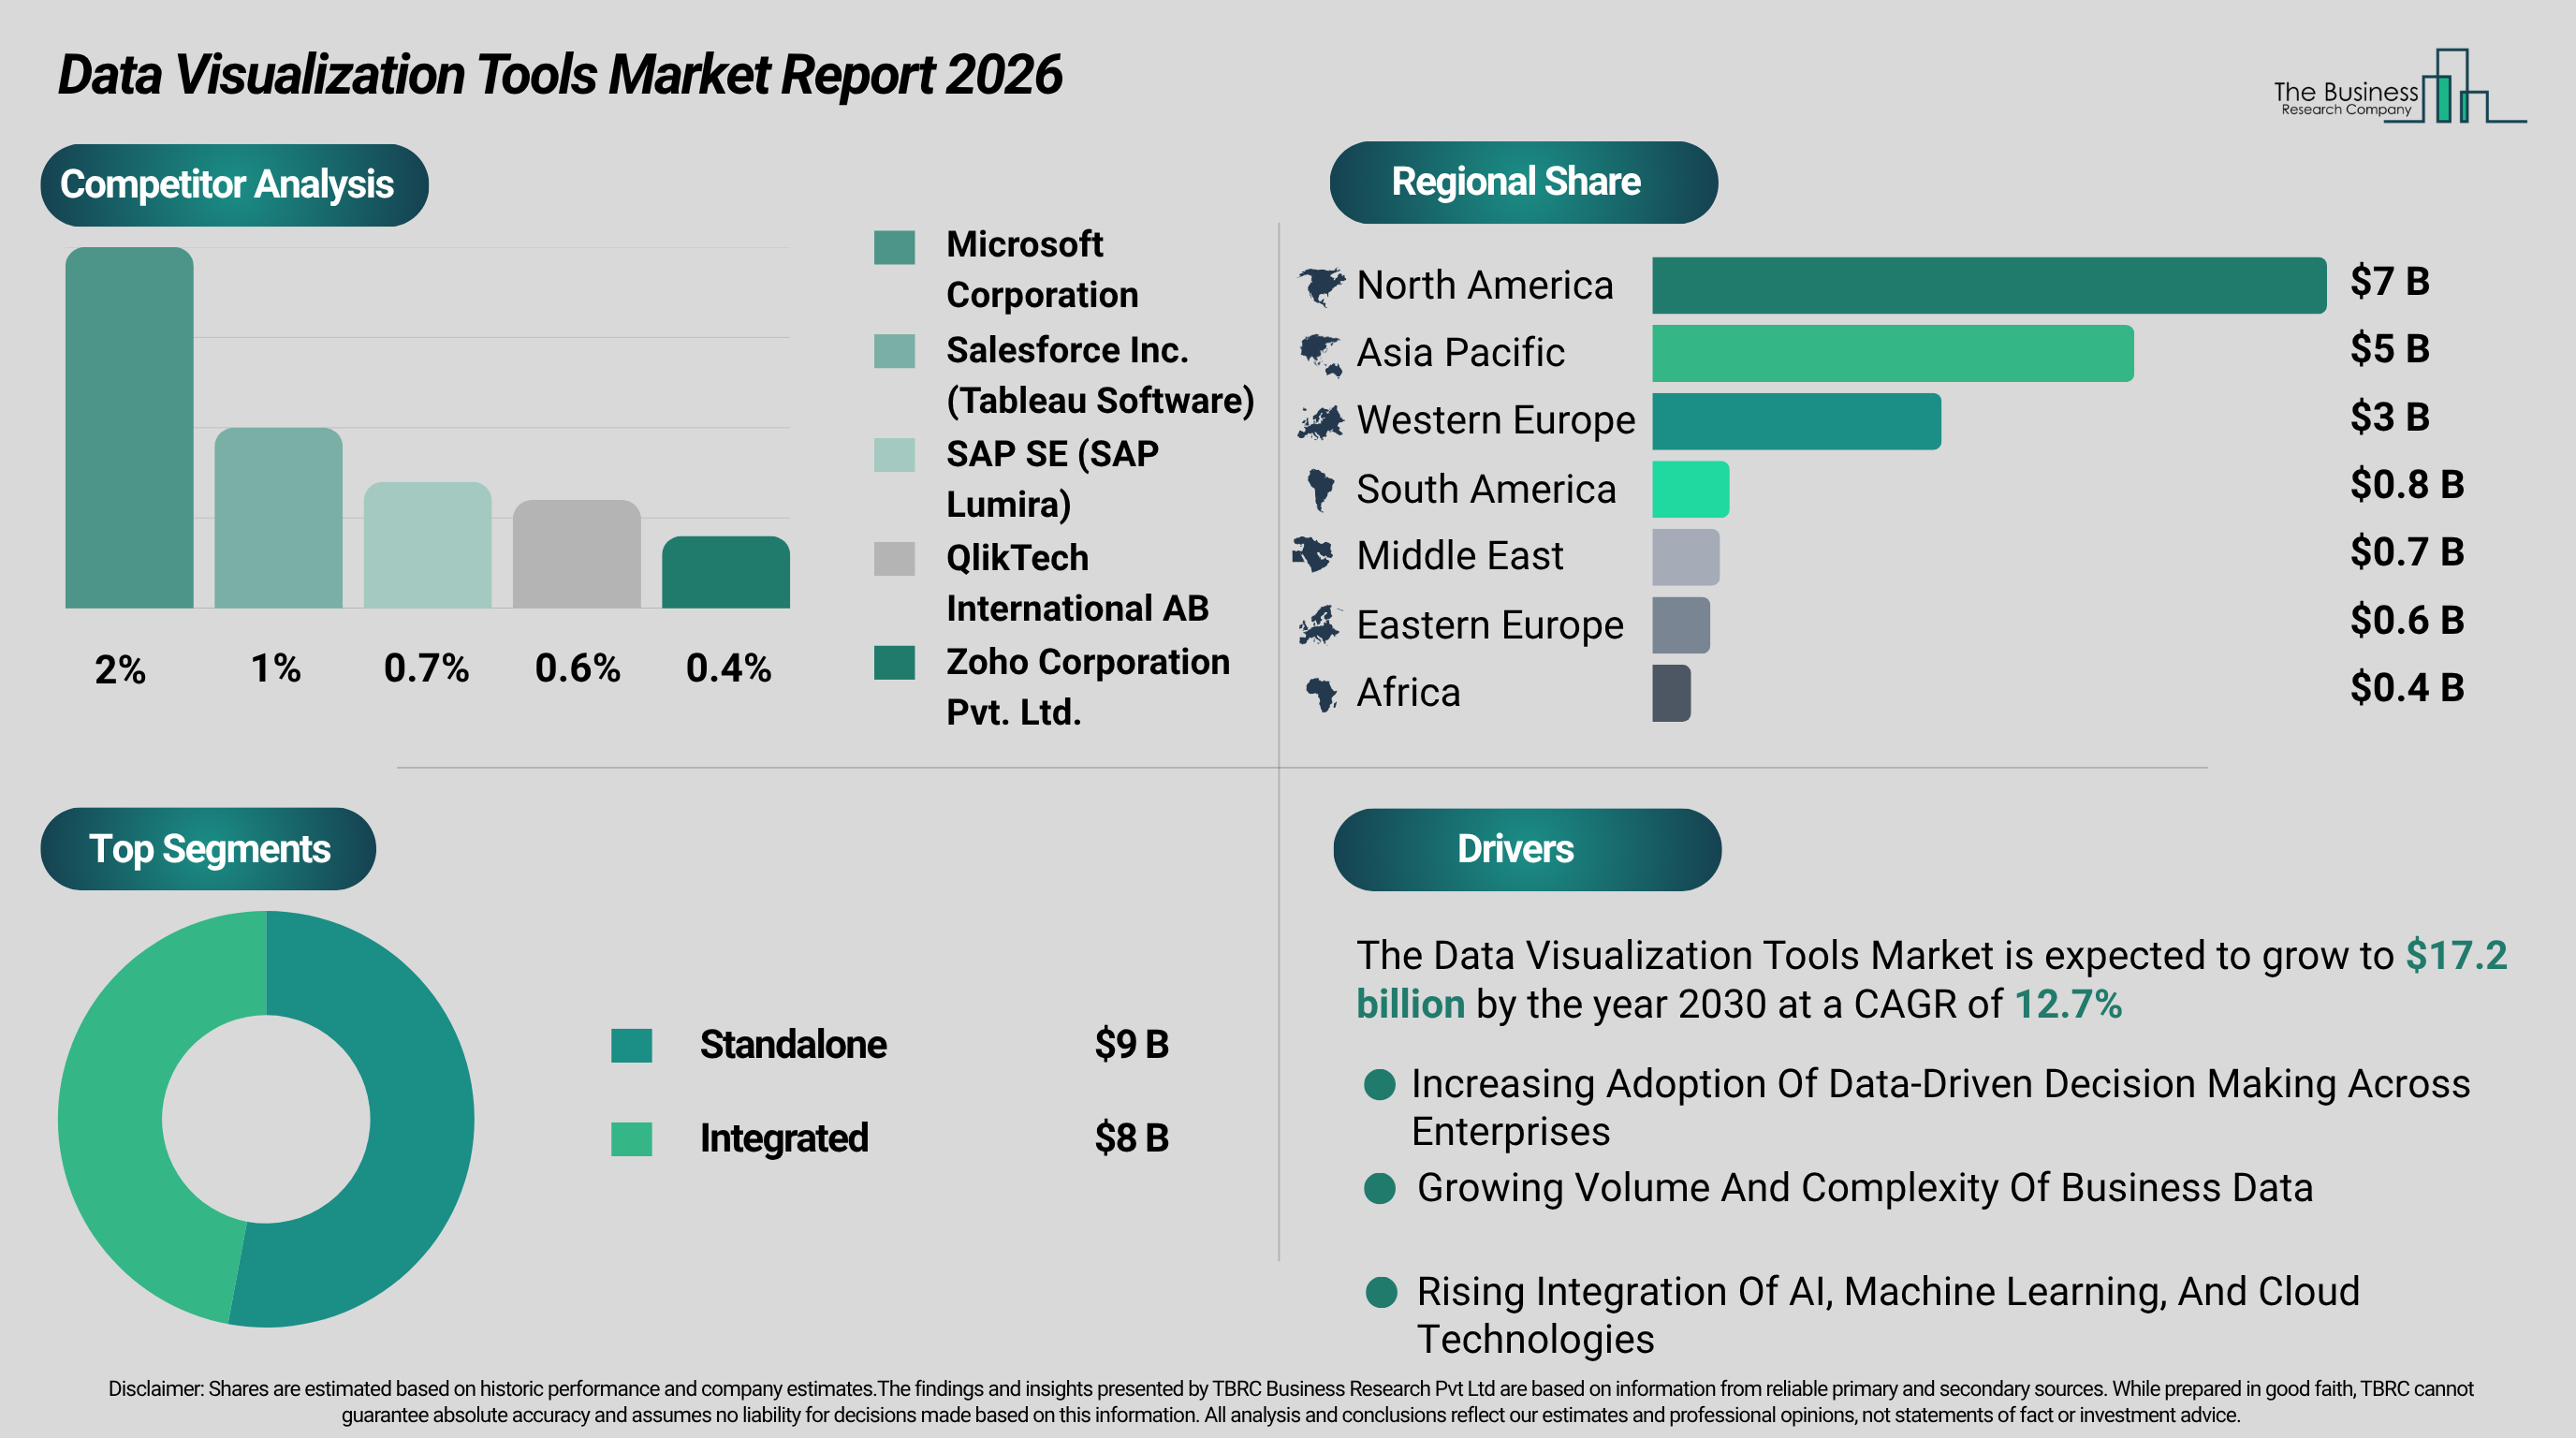
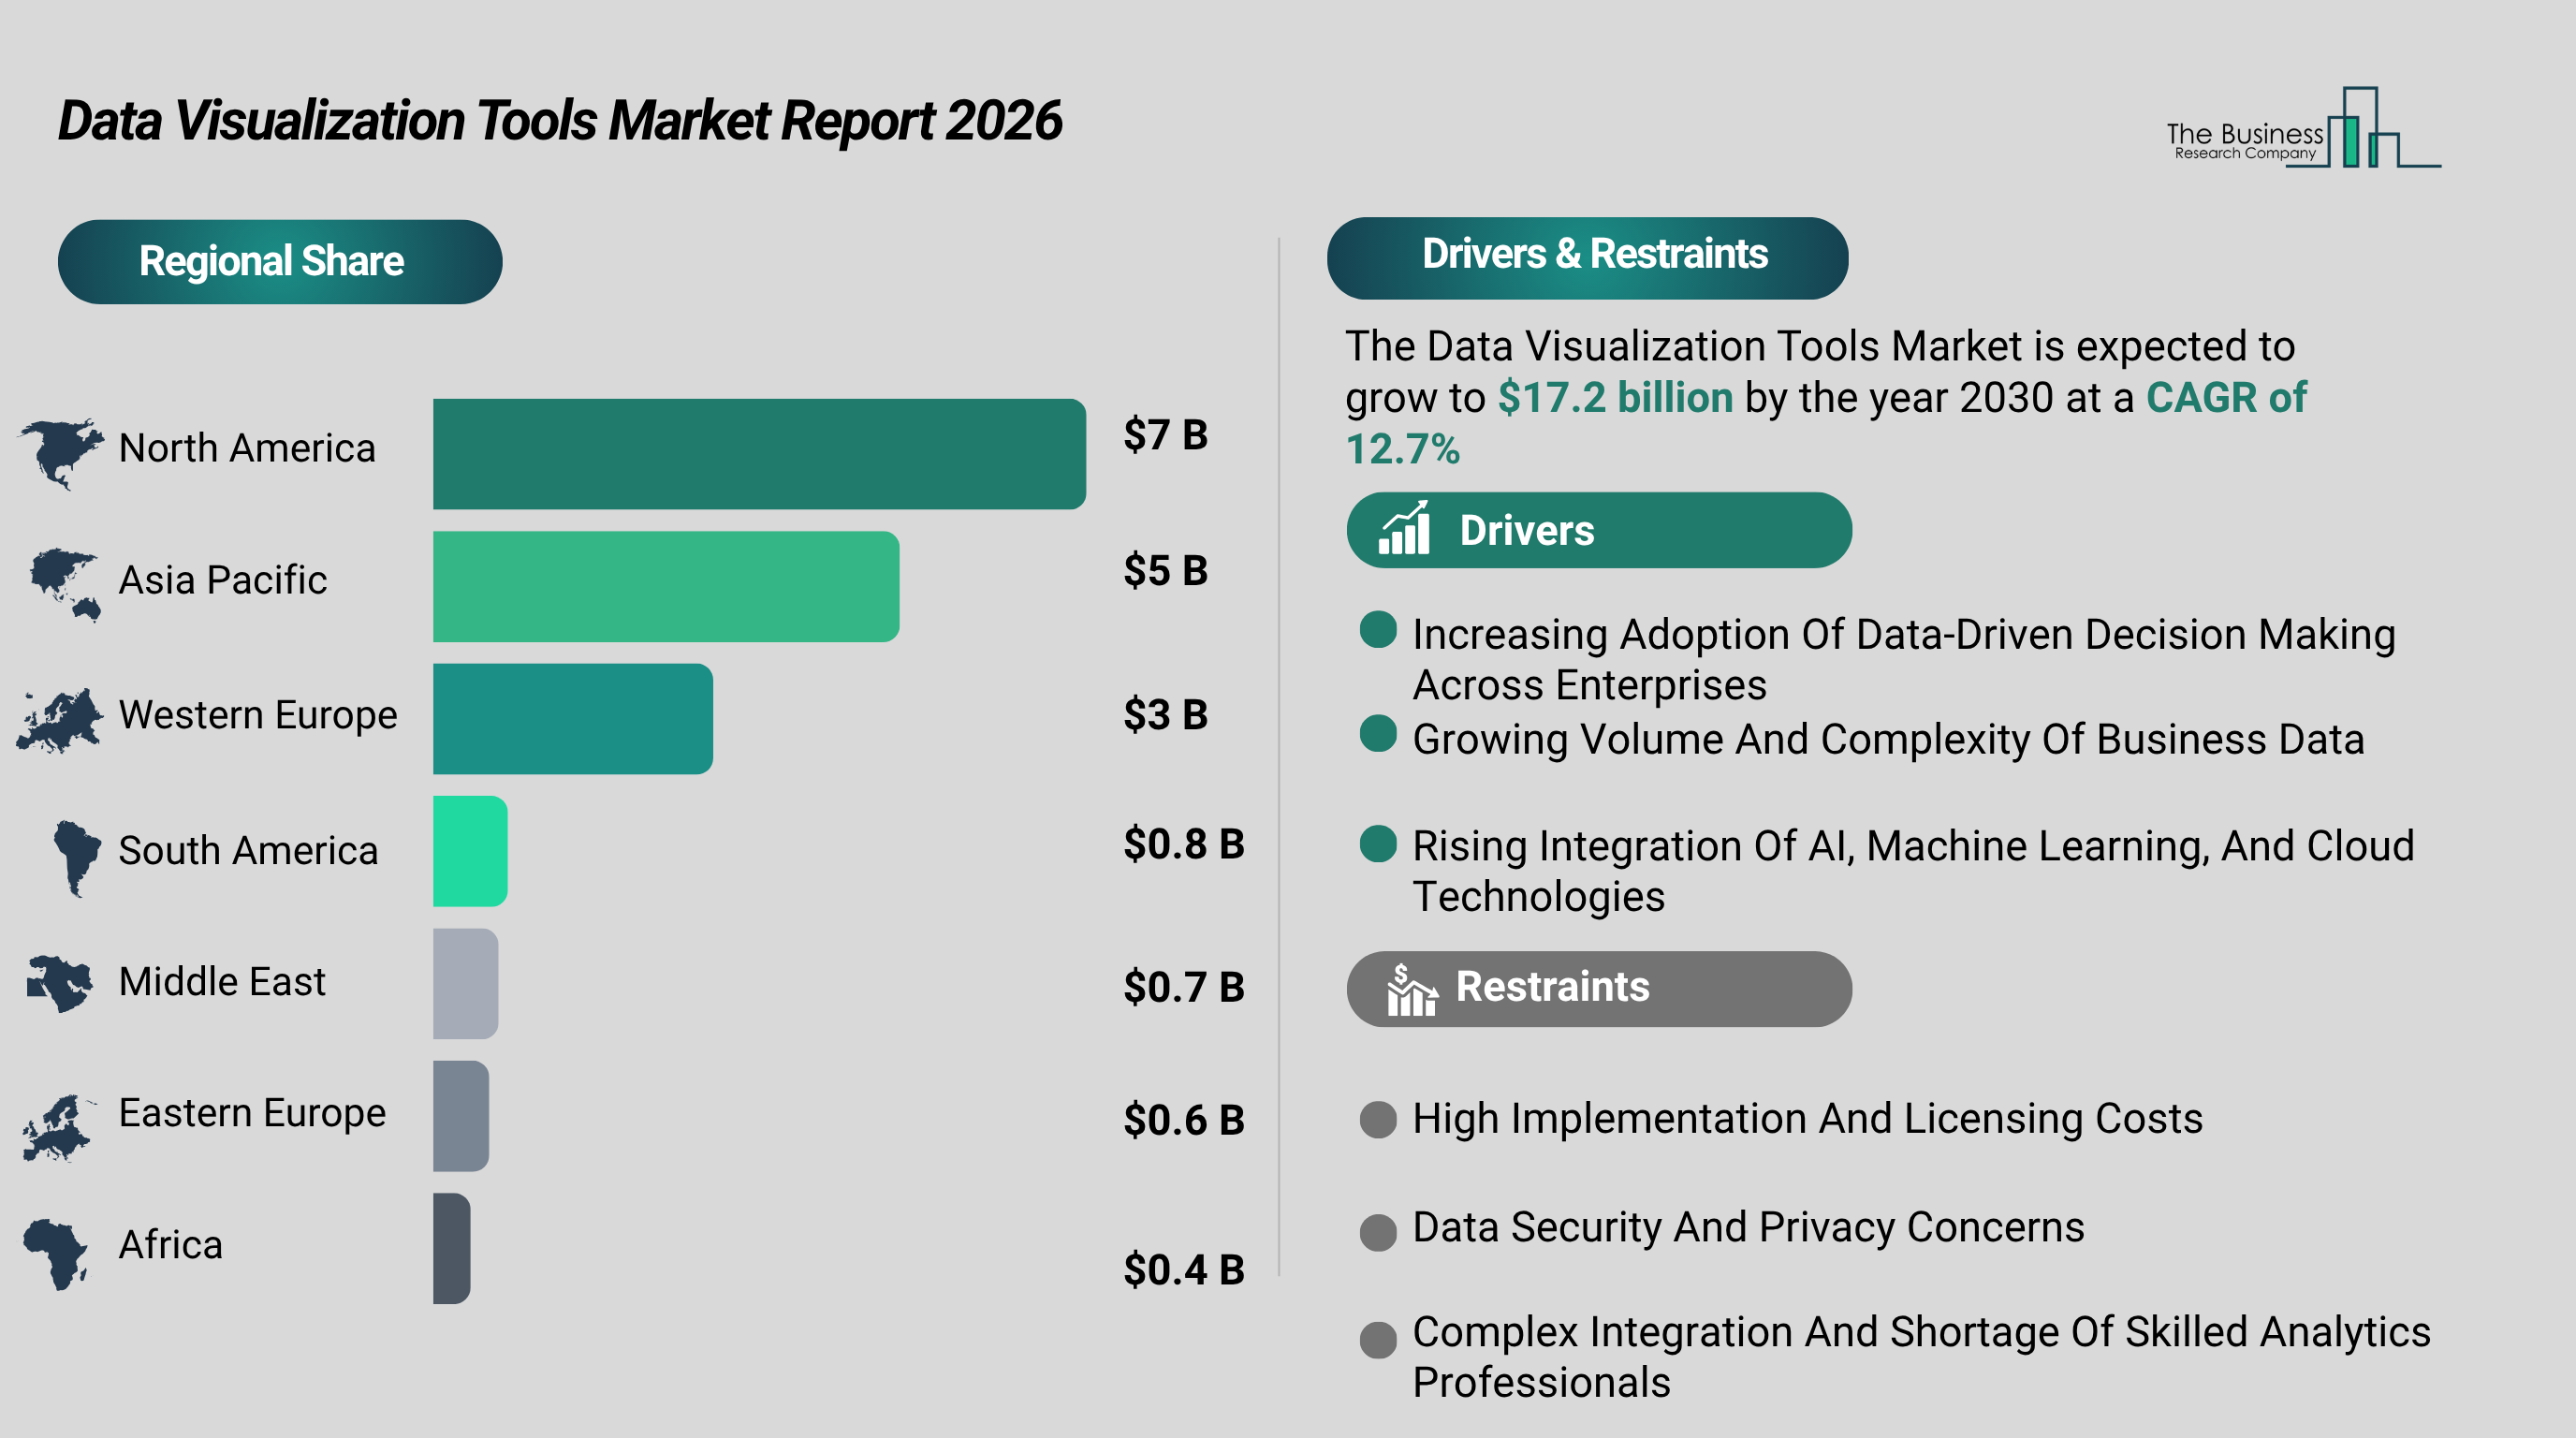
One major driver of growth is the widespread adoption of data-driven decision making across various enterprises. Companies increasingly depend on interactive dashboards, charts, and real-time reporting to convert complex datasets into actionable insights. This approach enables leaders to monitor key performance indicators, detect trends early, and respond swiftly, contributing approximately 2.1% to the annual market growth rate.
Another significant influence is the ever-increasing volume and complexity of business data. Organizations receive vast amounts of information from cloud applications, IoT devices, and multiple digital platforms, requiring sophisticated tools to consolidate and clearly present this data. This need helps businesses uncover patterns, correlations, and risks across diverse sources and is expected to add around 1.8% annual growth to the market.
Access The Detailed Data Visualization Tools Market Report Here
https://thebusinessresearchcompany.com/report/data-visualization-tools-global-market-report?utm_source=EINPresswire&utm_medium=Paid&utm_campaign=Oct_PR
The final key growth factor is the deeper integration of artificial intelligence, machine learning, and cloud technologies. AI-powered platforms automate data preparation, deliver predictive insights, recommend optimal visualization types, and detect anomalies. Cloud deployment facilitates remote access, scalability, and collaboration, making advanced data visualization accessible across industries. This integration is projected to contribute roughly 1.4% annually to market expansion.
Core Segments within the Data Visualization Tools Market
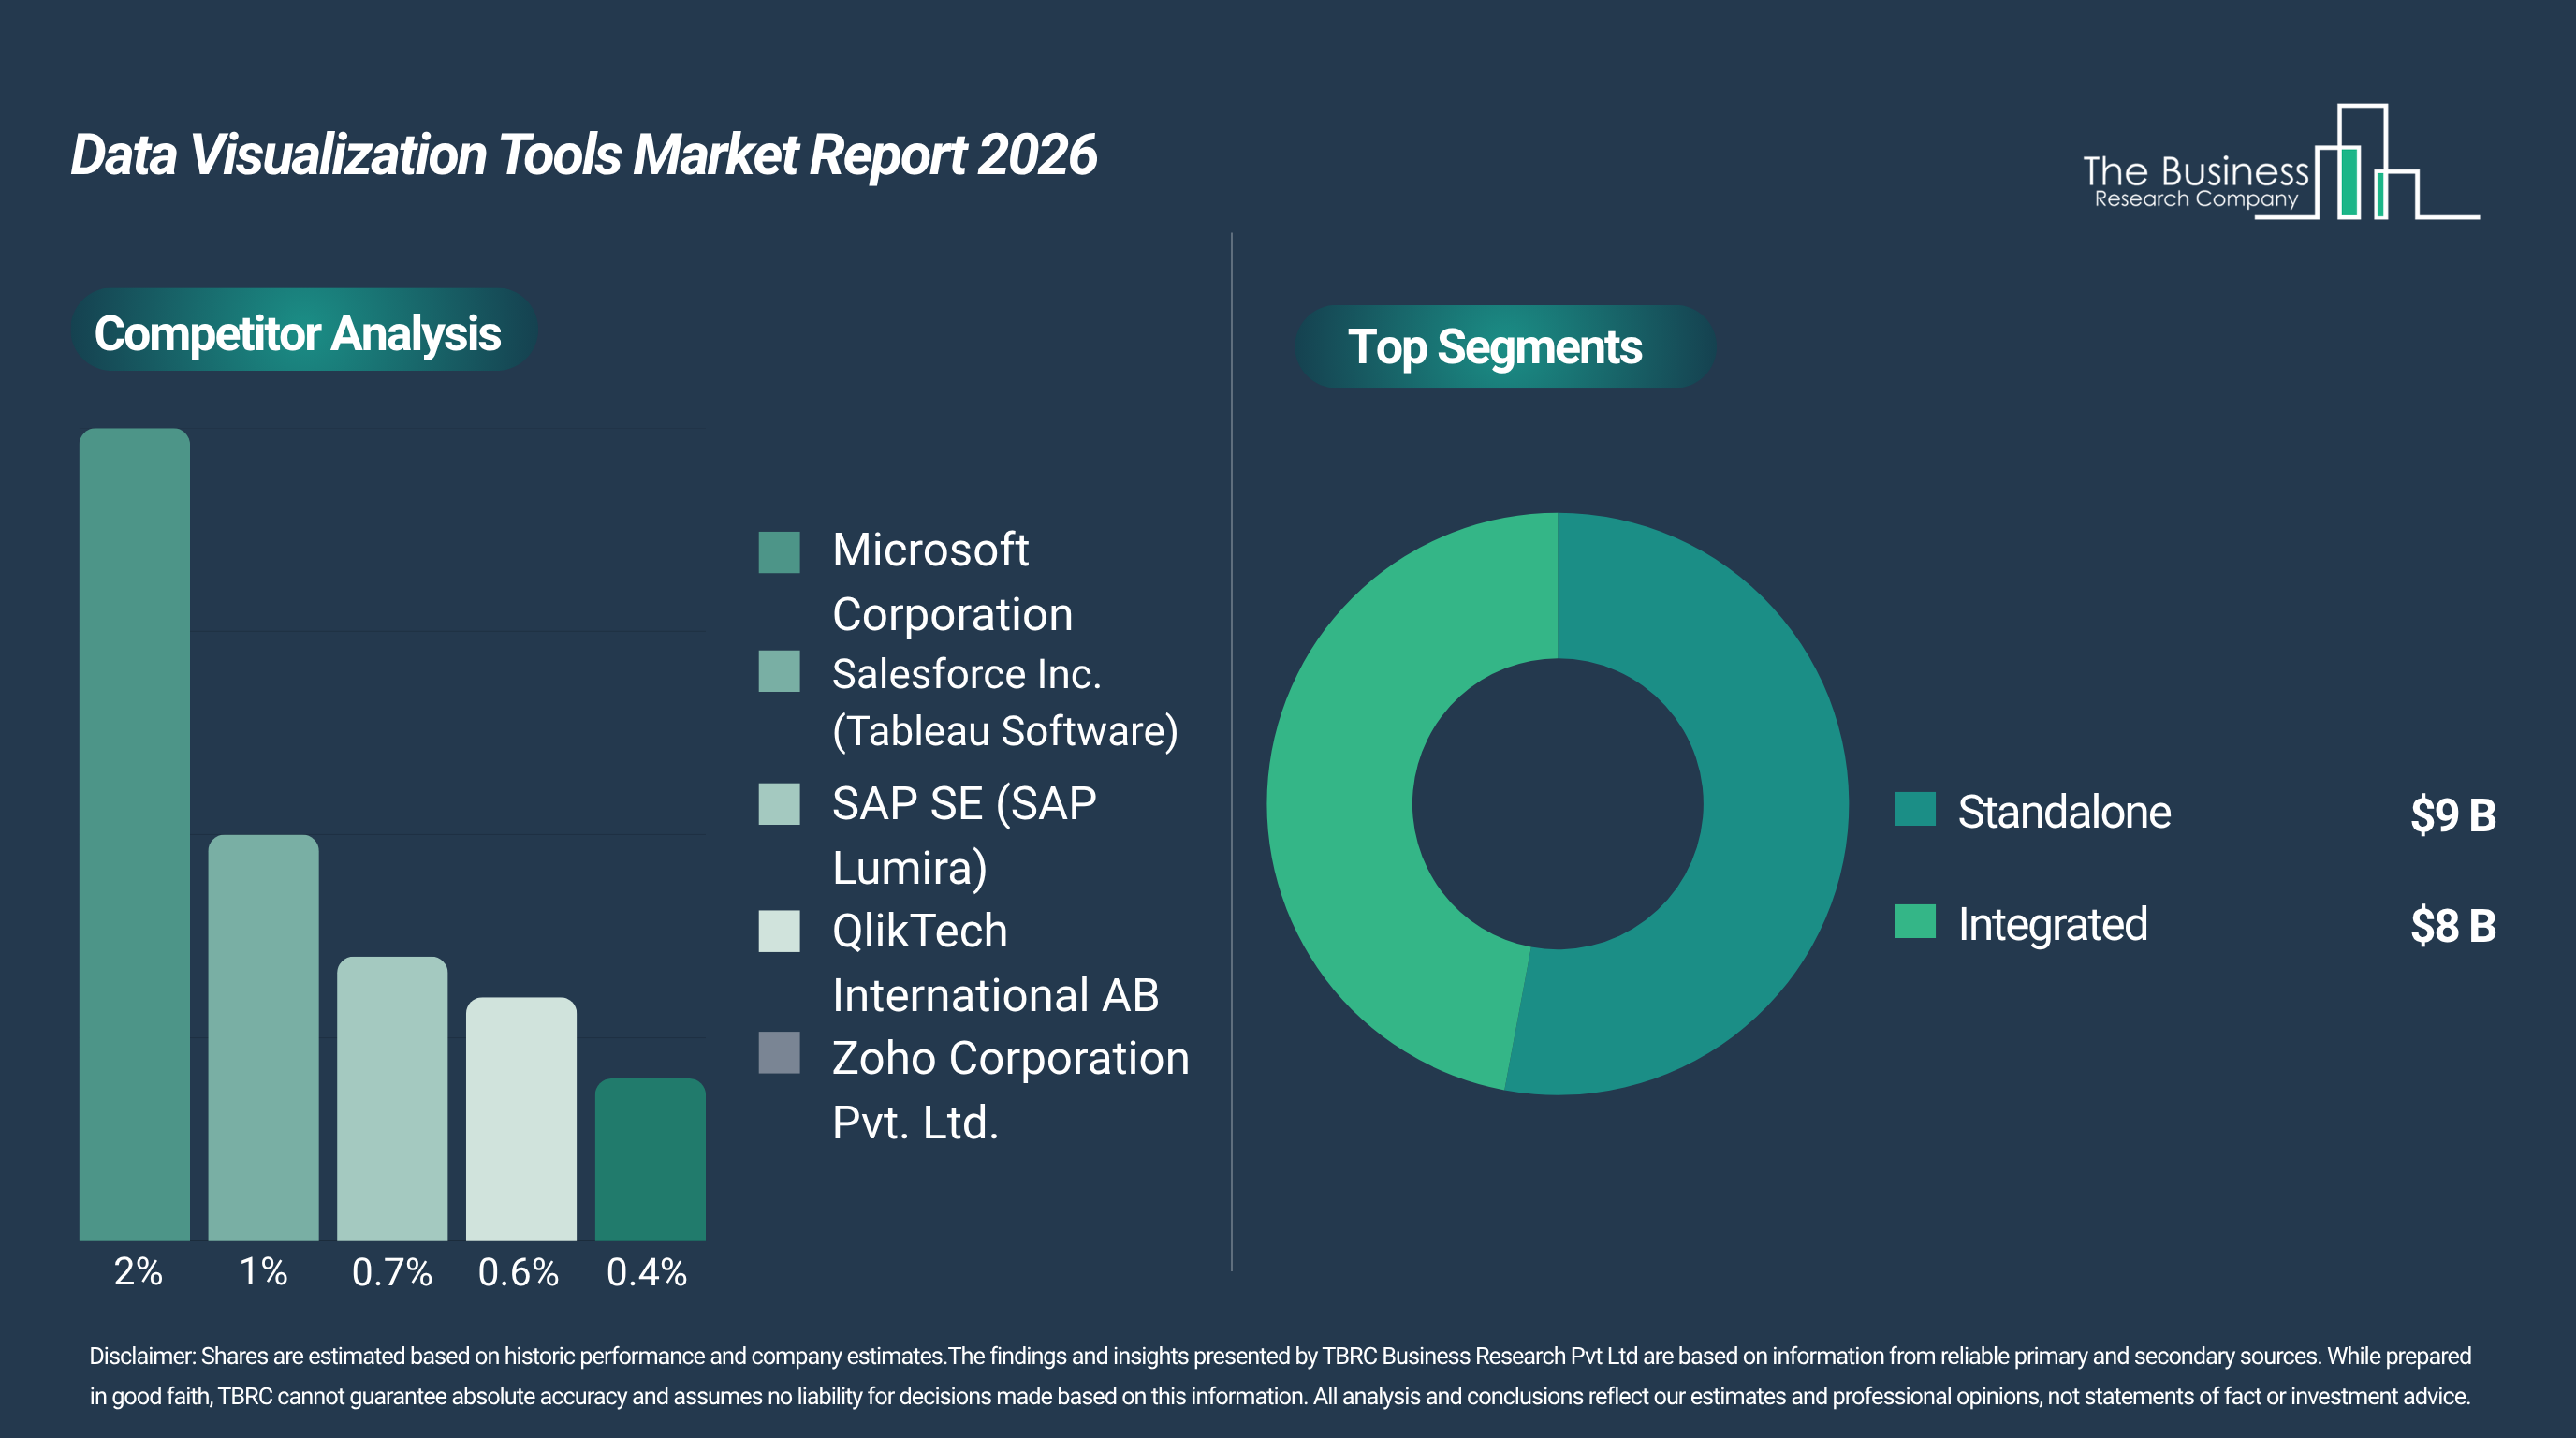
The market divides primarily into standalone and integrated data visualization tools. Standalone products are set to dominate in 2030, capturing 53% of the market share or about $9 billion. Their popularity stems from dedicated platforms offering extensive customization, user-friendly dashboard creation with minimal coding, and enhanced features that improve data exploration and presentation for business users.
Further segmentation includes breakdowns by business function—such as marketing and sales, human resources, operations, and finance—deployment type (on-premises versus cloud), organization size (large enterprises versus small and medium-sized businesses), and industry verticals. These verticals cover sectors like banking, government, healthcare, retail, manufacturing, logistics, telecommunications, and IT, among others.
Regional Market Leadership and Growth Patterns
North America is poised to remain the largest regional market for data visualization tools in 2030, with an estimated value of $7 billion, up from $4 billion in 2025. This growth, representing a compound annual rate of 12%, is propelled by the rising use of self-service business intelligence platforms, executive demand for interactive dashboards, and initiatives to improve data literacy across enterprises, making complex information easier to understand.
Country-Specific Market Forecast for Data Visualization Tools
The United States will hold the top position globally within this market, expected to reach $6 billion in 2030, doubling from $3 billion in 2025 at a 12% CAGR. Growth is driven by demands for real-time performance tracking, sophisticated reporting systems in data-intensive industries, AI-enhanced analytics, and ongoing investments in digital business intelligence ecosystems.
Competitive Environment of the Data Visualization Tools Market
The competitive landscape is shaped by global business intelligence vendors and specialized analytics firms. These companies invest heavily in advanced visualization platforms, real-time analytics, interactive dashboards, and AI-generated insights to enhance decision-making capabilities. Success in the market depends on delivering accessible, scalable solutions with robust integration across diverse data sources and superior user experiences.
Microsoft Corporation leads the market as of 2025, holding a 2% share. Its business applications and cloud services division offers a broad portfolio including data analytics platforms, visualization software, business intelligence tools, and cloud-based data management solutions underpinning enterprise reporting and analytics across varied industries.
Market Fragmentation and Share Distribution
The data visualization tools market is moderately fragmented, with the top 10 players accounting for only 7% of total revenue in 2025. This reflects moderate barriers to entry, including the necessity for strong analytics capabilities, secure connectivity to varied data sources, and continuous innovation in visualization technologies. Market leaders maintain their position through comprehensive platform offerings, long-term enterprise partnerships, global cloud infrastructure, and ongoing refinement of business intelligence solutions.
Leading companies by 2025 market revenue share include:
- Microsoft Corporation at 2%
- Salesforce Inc. (Tableau Software) at 1%
- SAP SE (SAP Lumira) at 1%
- QlikTech International AB at 1%
- Zoho Corporation Pvt. Ltd. at 0.4%
- Amazon Web Services Inc. at 0.4%
- Oracle Corporation at 0.3%
- ThoughtSpot Inc. at 0.3%
- SAS Institute Inc. at 0.3%
- International Business Machines Corporation at 0.3%.
Innovations and Emerging Solutions Transforming the Market
The rise of AI-powered visualization tools is revolutionizing the sector by enabling faster decision-making and greater operational insight. For example, in September 2024, GrubMarket introduced GrubAssist charts, an AI-driven visualization tool tailored for the food supply chain industry. It features natural language processing, dynamic charts, and intuitive reports that simplify data interpretation and support better operational decisions.
Key Growth Avenues in Data Visualization Tools
Both standalone and integrated tools present significant growth potential, predicted to add over $8 billion in market value between 2025 and 2030. Standalone tools alone are expected to grow by $4 billion, with integrated solutions adding another $4 billion. Innovations such as embedded analytics within enterprise applications, self-service business intelligence, collaborative data storytelling, real-time visualization, augmented analytics, and interactive reporting will fuel this expansion.
Competitive Strategies in the Data Visualization Tools Market
Leading players are focusing on advancing interactive visualization technologies to improve decision-making, refining platforms to enhance user experience, expanding cloud-based solutions to increase scalability and collaboration, and integrating AI to deepen insights and predictive analytics capabilities.
Key Industry Participants in the Data Visualization Tools Market
Major companies active in this segment include Microsoft Corporation, Salesforce Inc. (Tableau Software), SAP SE (SAP Lumira), QlikTech International AB, Zoho Corporation Pvt. Ltd., Amazon Web Services Inc., Oracle Corporation, ThoughtSpot Inc., SAS Institute Inc., International Business Machines Corporation, Sisense Inc., Domo Inc., Alphabet Inc. (Google Data Studio), Periscope Data Inc., MicroStrategy Incorporated, Alibaba Group Holding Limited, TIBCO Software Inc., Alteryx Inc., GoodData Corporation, Yellowfin Business Intelligence, Zegami Ltd., Datawrapper Gmbh, Klipfolio Inc., and Slemma.
Overview of Supply Chain and End Users
The supply chain includes key raw material and technology providers such as Microsoft Corporation, Oracle Corporation, IBM Corporation, SAP SE, Salesforce, Adobe Inc., Google LLC, Amazon Web Services, NVIDIA Corporation, Intel Corporation, Dell Technologies, Hewlett Packard Enterprise, Cisco Systems, Lenovo Group, Snowflake Inc., Databricks Inc., MongoDB, Cloudera, Teradata, SAS Institute, MicroStrategy, QlikTech, TIBCO Software, Alteryx, and Palantir Technologies.
Wholesalers and distributors supporting this market feature companies like Ingram Micro, Arrow Electronics, Avnet, CDW Corporation, Insight Enterprises, SHI International, Softchoice Corporation, Computacenter, Bechtle AG, ALSO Holding AG, Esprinet, ScanSource, Exclusive Networks, Westcon Group, Redington Limited, D&H Distributing, Connection Public Sector Solutions, Zones LLC, World Wide Technology, Presidio Networked Solutions, Trace3 LLC, ePlus Inc., and Sirius Computer Solutions.
End users encompass leading analytics and BI firms such as Tableau Software, ThoughtSpot, Domo, Sisense, Looker Data Sciences, Dundas Data Visualization, Zoho Corporation, Board International, Yellowfin International, InetSoft Technology, Information Builders, GoodData, Birst, Logi Analytics, SAS Visual Analytics, and corporate users including Spotify, Uber, JPMorgan Chase, Walmart, Pfizer, Siemens, General Electric, Ford, Coca-Cola, and Nestlé.
In sum, the data visualization tools market is positioned for robust growth driven by technological innovation, expanding data complexity, and increasing enterprise reliance on visual analytics. Companies that excel in AI integration, cloud deployment, and user-friendly customization stand to gain a competitive edge in this rapidly evolving space.
What’s new in our 2026 market reports:
• Market attractiveness scoring and analysis
• Total addressable market (TAM) analysis
• Company scoring matrix graphics and tables
• Excel dashboards
• Market hotspots infographics
• Key technologies and future trends
• Updated graphics and tables
Learn More About The Business Research Company
The Business Research Company (www.thebusinessresearchcompany.com) is a leading market intelligence firm renowned for its expertise in company, market, and consumer research. We have published over 30,000+ reports across 27 industries and 60+ geographies. Our research is powered by 1,500,000 datasets, extensive secondary research, and exclusive insights from interviews with industry leaders.
We provide continuous and custom research services, offering a range of specialized packages tailored to your needs, including Market Entry Research Package, Competitor Tracking Package, Supplier & Distributor Package and much more.
Disclaimer: Please note that the findings, conclusions and recommendations that TBRC Business Research Pvt Ltd delivers are based on information gathered in good faith from both primary and secondary sources, whose accuracy we are not always in a position to guarantee. As such TBRC Business Research Pvt Ltd can accept no liability whatever for actions taken based on any information that may subsequently prove to be incorrect. Analysis and findings included in TBRC reports and presentations are our estimates, opinions and are not intended as statements of fact or investment guidance.
Contact Us:
The Business Research Company
Americas +1 310-496-7795
Europe +44 7882 955267
Asia & Others +44 7882 955267 & +91 8897263534
Email: marketing@tbrc.info
Follow Us On:
LinkedIn: https://in.linkedin.com/company/the-business-research-company
Oliver Guirdham
The Business Research Company
+44 7882 955267
info@tbrc.info
Visit us on social media:
LinkedIn
Facebook
X
Legal Disclaimer:
EIN Presswire provides this news content "as is" without warranty of any kind. We do not accept any responsibility or liability for the accuracy, content, images, videos, licenses, completeness, legality, or reliability of the information contained in this article. If you have any complaints or copyright issues related to this article, kindly contact the author above.
